The Benefits of Demand Response
Demand response programs help utility companies reduce peak load, shift load, or reduce overall usage by adjusting the timing and amount of electricity use. This can include shifts by end-use customers in normal electric consumption in response to changes in the price of electricity over time or incentive payments designed to induce lower electricity use at times of high wholesale market prices or when system reliability is jeopardized.
Demand Response Resources from Drawdown Georgia
Market Readiness And Available Technology
Advancements in demand response technology are making the power grid more flexible and efficient. Innovations like smart grids, dynamic pricing, and advanced metering infrastructure (AMI) have strengthened demand response capabilities. In Georgia, over 90% of meters are now advanced, including all 2.4 million Georgia Power customers. This allows utilities to manage electricity demand more quickly and accurately.
Technologies like direct load control (DLC) help utilities shift and reduce peak loads by controlling heat pumps, water heaters, air conditioners, and EV chargers. Georgia has also focused on smart thermostats and direct load control programs. For example, Georgia Power’s Thermostat Demand Response Program offers financial incentives for customers to install smart thermostats, helping utilities manage HVAC loads during peak demand.
As part of its grid modernization efforts, Georgia Power has invested in Distributed Energy Resource Management Systems (DERMS). This advanced technology improves the visibility, forecasting, and control of distributed energy resources (DERs), ensuring a more reliable and efficient grid.
Demand Response as a Climate Solution in Georgia
The Drawdown Georgia research team estimates that Georgia could reduce emissions by one megaton (Mt) of CO2e if 187,000 households shift 10% of their peak electricity use to off-peak.

What is the Carbon Emissions Reduction Potential by 2030?
Achievable reduction potential is derived by taking the technical reduction potential, outlined below, and developing a more realistic forecast that takes current rates of deployment, market constraints, and other barriers into consideration.
For demand response, the Drawdown Georgia research team has calculated the achievable reduction potential to be 1.37 Mt of CO2e.
What Is the Upper Limit of Carbon Emissions Reduction Potential?
Technical reduction potential reflects the upper limit of emissions reductions for this solution without regard to the constraints that exist in the real world, such as economic or political considerations.
For demand response, the Drawdown Georgia research team has calculated the technical reduction potential to be 1.45 Mt.
Progress on Demand Response in Georgia
Enrollment in demand response programs like TOU (Time-of-Use) pricing and Peak Time Rebates (PTRs) continues to expand, with approximately 335,000 households enrolled in 2023—an increase of 17% from 2022.
Demand response participation in Georgia varies widely. A few counties lead in adoption, while most lag behind. This disparity is evident in the median score of 1.73 compared to the much higher mean of 6.07, showing that a small number of counties significantly raise the average. The highest adoption rates are in the suburbs and exurbs of the Atlanta metro area, particularly in areas served by electric membership cooperatives like Snapping Shoals and Sawnee.
Georgia's regulatory landscape is evolving to support demand response expansion. The Federal Energy Regulatory Commission’s (FERC) Order No. 2222 aims to increase the participation of distributed energy resources (DERs), including demand response, in wholesale electricity markets. However, its impact on demand response adoption in Georgia is still uncertain.
One example of demand response in action is the Altus at the Quarter microgrid smart community in Atlanta, developed by Pulte Homes. This first-of-its-kind demonstration project shifts electricity demand from heat pump water heaters to reduce peak usage.For modeling purposes, we assume demand response can shift one hour of electricity use during peak periods—typically supplied by natural gas—into two equal parts: 30 minutes powered by solar (potentially via home storage) and 30 minutes reduced through appliance cycling (i.e., lower consumption). This reflects the goals of some demand response programs, including the Altus at the Quarter microgrid. We also assume that each family’s peak load is 4.39 kW, based on Georgia Power data from 2019.
Challenges in Scaling Demand Response
Despite the technological advancements and policy support for demand response, participation remains limited, particularly among low-income and rental households. Barriers to adoption include a lack of awareness, split incentives between landlords and tenants, and limited access to smart appliances and energy management systems. Additionally, concerns about fairness and equity persist, as many demand response programs primarily benefit homeowners with flexible energy use patterns, while renters and lower-income households are less likely to participate.
Responses to a Georgia Tech/UGA survey, funded by Drawdown Georgia, of nearly 1,700 state residents found the following results.
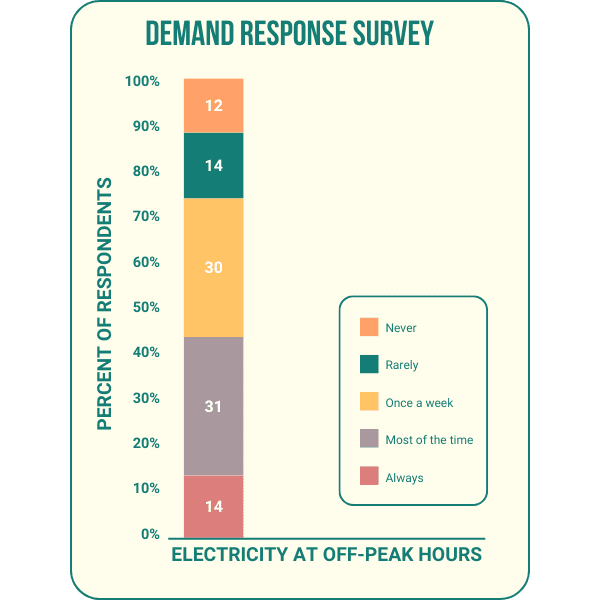
According to the survey, 31% of respondents engage in demand response strategies "most of the time," while 30% do so "once in a while." However, only 14% are consistently proactive in adjusting their electricity usage to align with grid demand. This suggests that while awareness exists, participation could be influenced by factors such as the lack of real-time energy pricing, limited incentives, or the inconvenience of adjusting household energy habits.
A promising policy direction is the expansion of incentive-based demand response programs, such as direct load control, which provide financial rewards for consumers who reduce demand during peak periods. Additionally, utility-led programs that integrate demand response with energy efficiency upgrades could enhance participation rates while delivering broader energy savings.
How Reliable Is Our Estimate For This Drawdown Georgia Climate Solution?
We used GT-NEMS to model demand response as an increase from 3% to 20% maximum peak load shift in 2030. This would produce a total reduction of 3.6 MtCO2 in the SERC SE region, which equates to 1.63 Mt CO2 in Georgia. This peak load shift could produce a reduction of summer peak demand of 365 MW.
This would result in an estimated reduction of 164 MW summer peak load in Georgia. Based on shifting 20% of the 4.4 KW peak load of an average household in Georgia, this reduction in summer peak is equivalent to 187,000 households in Georgia participating in a demand response program.
Cost Competitiveness
Smith and Brown (2015) found that demand response is likely to defer significant amounts of expensive, aging peak capacity such as single-cycle natural gas. Georgia Power conducts EE education initiatives as a pillar of demand-side management (DSM) and demand response programs as a way of achieving flexibility and clean energy goals.
Digitally connected energy technology, such as NEST thermostats and home energy management systems (HEMS), enable consumers to visualize, monitor, and manage electricity consumption within their household. Smith and Brown (2015) provide evidence that "suggests that demand response can serve as a long-term, low-cost alternative for peak-hour load balancing without increasing carbon emissions."
Beyond Carbon Attributes
Beyond its contributions to carbon emissions reductions, demand response offers multiple co-benefits that extend across economic, social, and environmental domains. By reducing peak demand, demand response helps lower electricity prices, benefiting not only those who actively participate in these programs but also non-participants through the demand-reduction-induced price effect (DRIPE).
This indirect cost-saving mechanism makes demand response a more equitable solution compared to other clean energy policies that tend to shift costs onto those who are unable to adopt new technologies. However, while demand response has the potential to improve affordability, lower-income households often face significant challenges in adjusting their behavior to maximize these benefits. Many of these households have limited flexibility in their energy use due to rigid work schedules, a lack of remote work options, or the need for consistent heating and cooling in poorly insulated homes.
Additionally, renters, who often have little control over appliances and heating systems, may find it difficult to participate in programs that require smart thermostats or load-controllable HVAC systems. These barriers highlight the need for more inclusive demand response policies that ensure low-income and renting households can access and benefit from these programs.
In addition to cost savings, demand response contributes to public health by reducing reliance on coal and gas peaker plants, which tend to be inefficient and high-emitting. As peak loads decrease, emissions of nitrogen oxides (NOₓ), sulfur dioxide (SO₂), and particulate matter decline, leading to improved air quality and lower rates of respiratory illnesses, particularly in urban and lower-income communities that are disproportionately affected by air pollution.
A real benefit of demand response is enhanced grid resilience and reliability because it creates a decentralized and flexible alternative to traditional power generation. By shifting and reducing demand during peak periods, demand response alleviates stress on the grid, lowers the risk of blackouts during extreme weather events, and improves overall energy security.