The Benefits of Electric Vehicles
Electric vehicles (EVs) are powered by electric batteries that emit lower levels of greenhouse gas emissions than conventional fuels such as gasoline and diesel. The exact emissions vary depending on the generation mix providing the electricity.
Access EV Resources from Drawdown Georgia
Market Readiness and Available Technology
EVs are available in the marketplace in light-duty vehicle (LDV) applications (Note: there are EVs for other transportation solutions that are not included as one of Drawdown Georgia’s 20 Solutions.).
Over the last decade, Georgia provided state subsidies in the form of a tax credit on new EVs that led to significant new EV sales. Those subsidies expired in 2016.
Adoption rates during the subsidy period demonstrate a huge potential for EVs in the Georgia market. As of September 2024, over 100,000 EVs were registered in Georgia. The projected percentage share of new vehicle sales for EVs is estimated to reach 46% of total LDV sales in 2030. We assume that Georgia’s adoption will fall close to this national range, depending on future technology and policy scenarios.
Electric Vehicles as a Climate Solution in Georgia
The Drawdown Georgia research team estimates that Georgia could reduce emissions by one megaton (Mt) of CO2e by replacing 250,000 gasoline-powered vehicles with EVs.

What is the Carbon Emissions Reduction Potential by 2030?
Achievable reduction potential is derived by taking the technical reduction potential, outlined below, and developing a more realistic forecast that takes current rates of deployment, market constraints, and other barriers into consideration.
For EVs, the Drawdown Georgia research team has calculated the achievable reduction potential to be 1.11 Mt of CO2e.
What Is the Upper Limit of Carbon Emissions Reduction Potential?
Technical reduction potential reflects the upper limit of emissions reductions for this solution without regard to the constraints that exist in the real world, such as economic or policy considerations.
For EVs, the Drawdown Georgia research team has calculated the technical reduction potential to be 2.53 Mt.
Progress on EVs in Georgia
In Q1 2023, the market share of new EV sales in Georgia was 6.8 percent – up from 4.3 percent in Q1 2022. Consequently, data is readily available and local markets have experienced high rates of adoption.
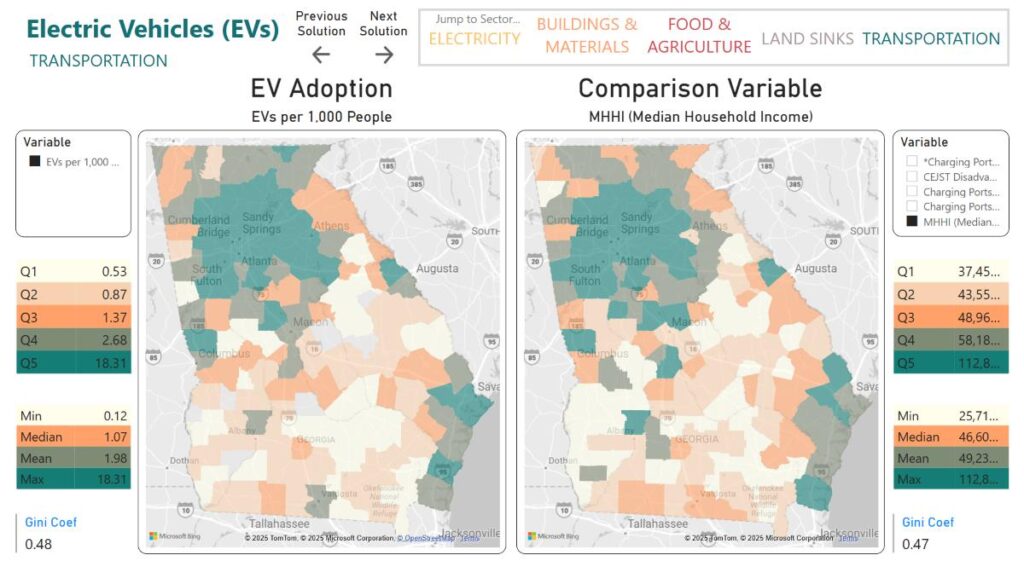
EV ownership in Georgia aligns with the state's charging infrastructure, with 110 of 159 counties having at least one public charging station. Adoption extends beyond metro Atlanta, following highways and coastal areas, and correlates with county median household income.
Federal incentives from the Inflation Reduction Act (IRA) and the Bipartisan Infrastructure Law aim to boost EV adoption and infrastructure (subject to change). The IRA removes manufacturer caps and offers a $7,500 tax credit for new EVs (subject to income and price limits) and a $4,000 credit (or 30% of cost) for used EVs.
The Bipartisan Infrastructure Law established the National Electric Vehicle Infrastructure (NEVI) program to fund EV charging expansion (subject to change). This $5 billion initiative will support 500,000 highway chargers nationwide. Georgia will receive $135 million from FY22-FY26.
How Reliable Is Our 2030 Estimate For This Drawdown Georgia Climate Solution?
EVs can significantly reduce CO2 emissions, especially when powered by renewable or net-neutral energy sources. Due to their efficiency, EVs still have lower emissions compared to gas-powered cars, even when using electricity from natural gas. The reduction potential depends on the energy grid mix, manufacturing emissions, and resource extraction.
By 2050, major reductions are possible, especially with high renewable energy adoption. Currently, EVs can cut emissions by 50g CO2e/km for a small, light-duty vehicle based on Georgia’s grid. With advancing technology, emissions reductions could improve by up to 50% more by 2030. Even with moderate EV adoption, Georgia’s personal and commercial light-duty vehicles have significant emissions reduction potential. However, the impact of increased electricity demand requires further study.
Cost Competitiveness
The cost of a new EV is expected to be comparable to that of internal combustion engine vehicles (ICEVs) over the next decade. Cost competitiveness will increase as manufacturing economies of scale are realized and adoption rates grow.
The adoption of EVs has been driven by advances in battery technology, improvements in energy density, reductions in battery costs, and the expansion of available models. BNEF’s 2023 Battery Price Survey estimates the average battery pack price to be $161/kWh in 2022 and projects that it will fall to $80/kWh in 2030.
Costs and benefits vary with regard to usage patterns but are broadly positive as technology becomes cheaper and more commonplace.
Reduced operation and maintenance costs should offer significant savings to consumers over vehicle lifetimes. More study is likely needed to determine the impact of charging infrastructure costs and electricity generation/rates and how these should be allocated to users or society as a whole.
Beyond Carbon Attributes
Localized air quality improvements from reduced greenhouse gas emissions improve both environmental and public health, although these benefits may not exist or may be limited in regions with high energy generation/producing facilities.
Other benefits include the creation of jobs associated with selling, installing, and maintaining batteries for EVs.
Research also indicates that when electric commercial trucks are stored in low-income communities, localized public health/air quality benefits (versus emission vehicles).
Battery disposal may create adverse environmental and health impacts.
Large-scale EV adoption will necessitate charging stations and related infrastructure investments that can potentially increase electricity rates.
What is the Gini Coefficient for EVs?
As with other solutions, such as solar, the higher costs of EV vehicles make access to this solution challenging for low-income communities. There is significant inequality in EV adoption across counties (Gini coefficient of 0.48), charging stations (0.47), and charging ports (0.48)